Updated: 2/3/2012. Thanks to Chris Cox who found a calculation error.
Many held high hopes for an improving real estate market heading into 2011. Well, maybe that’s an exaggeration but there were some signs that the housing recession was lessening and perhaps we would all see improvement in 2011. In most locations, that didn’t occur. But it did in some!
Looking back on 2011 home value changes
So here we find ourselves in a similar position; looking back on the year and trying to determine if 2012 would finally be the year where things went “back to normal.”
Let me describe normal. For years, Louisville home values annually appreciated 4-5% a year—almost like clockwork. You have to go back to the 1980s to find a year where homes didn’t increase in value.
Since the top of the market in 2007, however, that hasn’t been the case. According to the Federal Housing Finance Agency (FHFA), we didn’t actually see a decrease in home values until the midpoint of 2008. Since then, values have steadily declined. What’s worse is that 2011 appears to be the biggest loser of them all.
Home prices drop, home prices rise, all depends on location
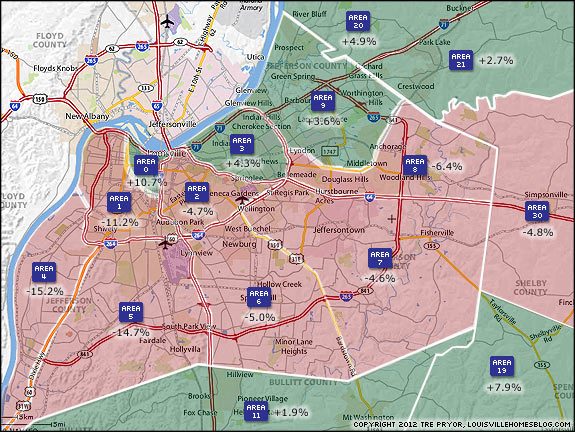
Now here is where it gets interesting. Homes in Jefferson County dropped an average of 4.56% of their value from December 2010 to December 2011 (comparing 1-year trailing averages). That’s likely pretty close to the number FHFA will publish later this year.
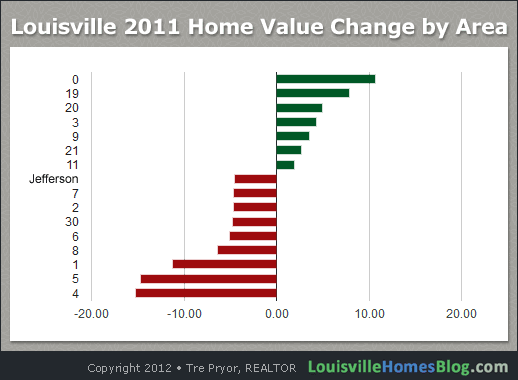
But what’s compelling is that depending on where you look in Louisville, some properties have actually increased in value. Homes in one Louisville MLS area appreciated over 10%!
To add more perspective, see how the different MLS areas ranked, with Jefferson County being the aggregate of Areas 0 through 9.
Include 2010 and Louisville home values change again
Because I have access to the data (and I’m a bit of a data nerd) I thought I’d see what the numbers looked like when you included 2010 as well.
| Area | Dec. 2009 | Dec. 2010 | Change | % | Dec. 2011 | Change | % | 2 Year |
| 20 | $222,366 | $253,189 | $30,823 | 13.86 | $265,732 | $12,544 | 4.95 | 19.50 |
| 2 | $141,417 | $161,108 | $19,692 | 13.92 | $153,533 | -$7,575 | -4.70 | 8.57 |
| 3 | $195,475 | $203,825 | $8,350 | 4.27 | $212,625 | $8,800 | 4.32 | 8.77 |
| 30 | $134,081 | $148,727 | $14,646 | 10.92 | $141,633 | -$7,094 | -4.77 | 5.63 |
| 19 | $168,458 | $164,763 | -$3,696 | -2.19 | $177,733 | $12,971 | 7.87 | 5.51 |
| 0 | $118,113 | $112,142 | -$5,970 | -5.05 | $124,138 | $11,995 | 10.70 | 5.10 |
| 9 | $199,540 | $203,442 | $3,902 | 1.96 | $210,792 | $7,350 | 3.61 | 5.64 |
| 21 | $217,697 | $215,304 | -$2,393 | -1.10 | $221,104 | $5,800 | 2.69 | 1.57 |
| Jeff | $128,603 | $136,513 | $7,910 | 6.15 | $130,283 | -$6,229 | -4.56 | 1.31 |
| 11 | $128,589 | $126,763 | -$1,827 | -1.42 | $129,191 | $2,428 | 1.92 | 0.47 |
| 8 | $226,322 | $241,200 | $14,878 | 6.57 | $225,842 | -$15,358 | -0.21 | 0.21 |
| 7 | $145,192 | $150,700 | $5,508 | 3.79 | $143,692 | -$7,008 | -4.65 | -1.03 |
| 6 | $120,183 | $119,713 | -$470 | -0.39 | $113,688 | -$6,026 | -5.03 | -5.40 |
| 5 | $96,153 | $97,700 | $1,547 | 1.61 | $83,338 | -$14,363 | -14.70 | -13.33 |
| 4 | $94,423 | $94,188 | -$236 | -0.25 | $79,867 | -$14,321 | -15.20 | -15.42 |
| 1 | $26,167 | $24,854 | -$1,313 | -5.02 | $22,063 | -$2,792 | -11.23 | -15.68 |
The data here shows that when you include both 2010 and 2011 home appreciation/depreciation together, 10 of the 15 MLS areas actually increased in value. Jefferson County in aggregate improved as well, even though it was slight.
Showing how volatile the real estate market is I want to provide this example. Louisville Area 2 (The Highlands, Butchertown, Germantown, and nearby areas) was down this past year almost 5%. Go back and include almost the increase for 2010, the net result is a positive 8.57%. Interesting.
The Internet and high-powered computers have put more data into our hands than we know what to do with but knowing how to slice and dice it reveals insights that can be very useful towards real estate buying and selling decisions.