What is the speed of home sales in my area? I’m glad you asked! Today, we’re going to answer that question for you. Let’s jump right in!
In 2014, I started a story series on LHB with Hottest Areas for Louisville Home Sales. Now that the “selling season” was upon us, I wanted to know where in Louisville Kentucky are homes selling the fastest.
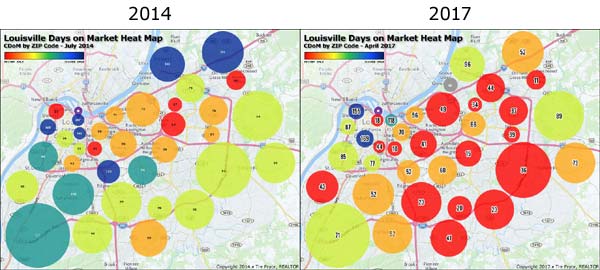
Jump forward three years and I wrote How Fast Are Homes Selling in My Area. As you can see by comparing the two heat maps I made for 2014 and 2017… things have really sped up!
To keep things consistent, I’ve performed the same analysis to create the Louisville days on market heat map for 2018. And as you’ll see, our market is even hotter this year.
The speed of home sales by ZIP code
There’s no doubt it’s a seller’s market. Inventory remains to be low so buyers are fighting over what homes are available. That makes them sell faster!
More expensive homes will always take longer to sell because there are fewer buyers looking for homes in the higher price ranges. You can look at our heat map below to see that phenomenon.
Homes in higher-priced areas, such as in the northeast part of the city, are taking significantly longer to sell. In less expensive parts of Louisville, homes are literally selling on their first or second day on the market.
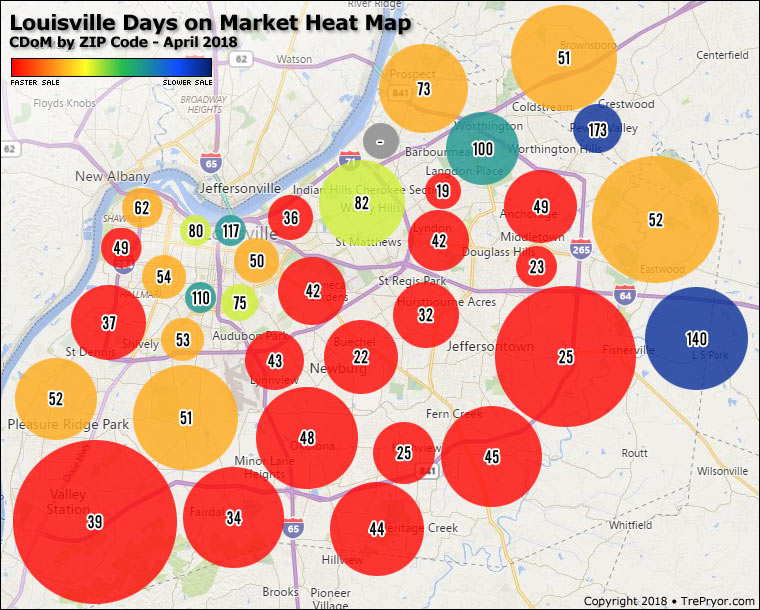
There’s even more red this year’s map! It’s quite amazing really. Out of all the ZIP codes surveyed in this report, only eight had a higher average CDoM of 75 days or more. In every other part of the city, homes are selling super fast.
I do want to make the distinction between Days on Market (DoM) and Cumulative Days on Market (CDoM). Basically, if a home seller wants to reset their DoM, they can cancel their listing and relist it with the same exact information. Their DoM starts again at zero.
In order for the CDoM to get reset, the home needs to be off the market for 90 days or more. So actually the DoM number is fairly worthless. Just focus on the CDoM like the pros do.
Here’s the data I used to build the map image sorted by the fastest home selling Louisville ZIP codes.
| ZIP Code | April 2018 | April 2017 |
| 40242 | 19 | 34 |
| 40218 | 22 | 60 |
| 40243 | 23 | 39 |
| 40228 | 25 | 20 |
| 40299 | 25 | 36 |
| 40220 | 32 | 15 |
| 40118 | 34 | 52 |
| 40206 | 36 | 56 |
| 40216 | 37 | 85 |
| 40272 | 39 | 71 |
| 40205 | 42 | 41 |
| 40213 | 43 | 52 |
| 40222 | 44 | 66 |
| 40229 | 44 | 41 |
| 40291 | 45 | 23 |
| 40219 | 48 | 23 |
| 40211 | 49 | 87 |
| 40223 | 49 | 37 |
| 40204 | 50 | 70 |
| 40014 | 51 | 52 |
| 40214 | 51 | 52 |
| 40245 | 52 | 89 |
| 40258 | 52 | 43 |
| 40215 | 53 | 77 |
| 40210 | 54 | 169 |
| 40212 | 62 | 155 |
| 40059 | 73 | 96 |
| 40217 | 75 | 10 |
| 40203 | 80 | 18 |
| 40207 | 82 | 49 |
| 40241 | 100 | 44 |
| 40208 | 110 | 44 |
| 40202 | 117 | 118 |
| 40023 | 140 | 73 |
| 40056 | 173 | 11 |
As you can see most ZIP codes had faster home sales in April 2018 than in April 2017. Not all though. Some slowed down considerably. How did yours fare?
It’s even better to look at individual neighborhoods but that would take an incredible amount of time for me to put together. But if you want to contact me and request it for your neighborhood. I’m happy to provide that free service.
The speed of home sales in Louisville
Now, you’re not likely to find this as interesting as I did but here goes. What would you expect the entire city of Louisville’s CDoM number might compare to the previous year? I mean, with all that red on the map it has to be a lot lower, right?!
Actually, it is lower but only by a single day. In April 2017 the CDoM for Jefferson County was 52 days. This past April it dropped to 51. How is that possible? Well, you might be familiar with the old quote:
“There are three kinds of lies: lies, damned lies, and statistics.” -Benjamin Disraeli
Another year in the books. Let me know if I can help you further!